 Sahab Media


As the date for US presidential election fast approaches, an analysis based on the examination of tweets yields some interesting insights.
With Election Day (November 8) in the US fast approaching, results of almost every poll the mainstream media runs show that the Democratic nominee will beat her republican rival by a landslide. But results of our data mining processes show something quite different. Analyzing more than 22 million tweets in the US regarding the country’s presidential election, our statistics say that Donald Trump is currently the leading candidate and his popularity is increasingly growing.
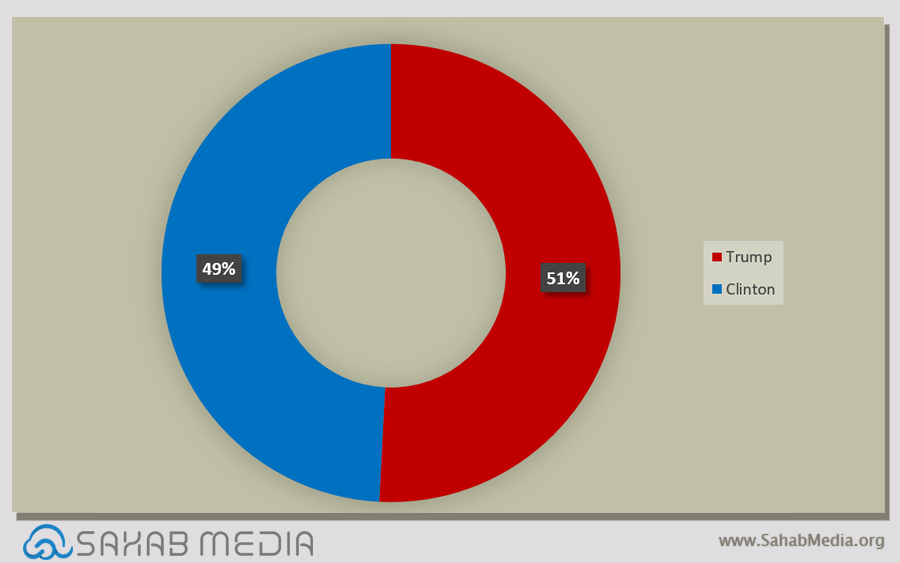
According to the results obtained by Sahab Media’s Data Mining Center, 22,057,505 tweets written by 3,127,119 users were examined during the period between September 19 and October 18 using the Stream technique. According to the report, nearly half of the tweets were about each candidate:
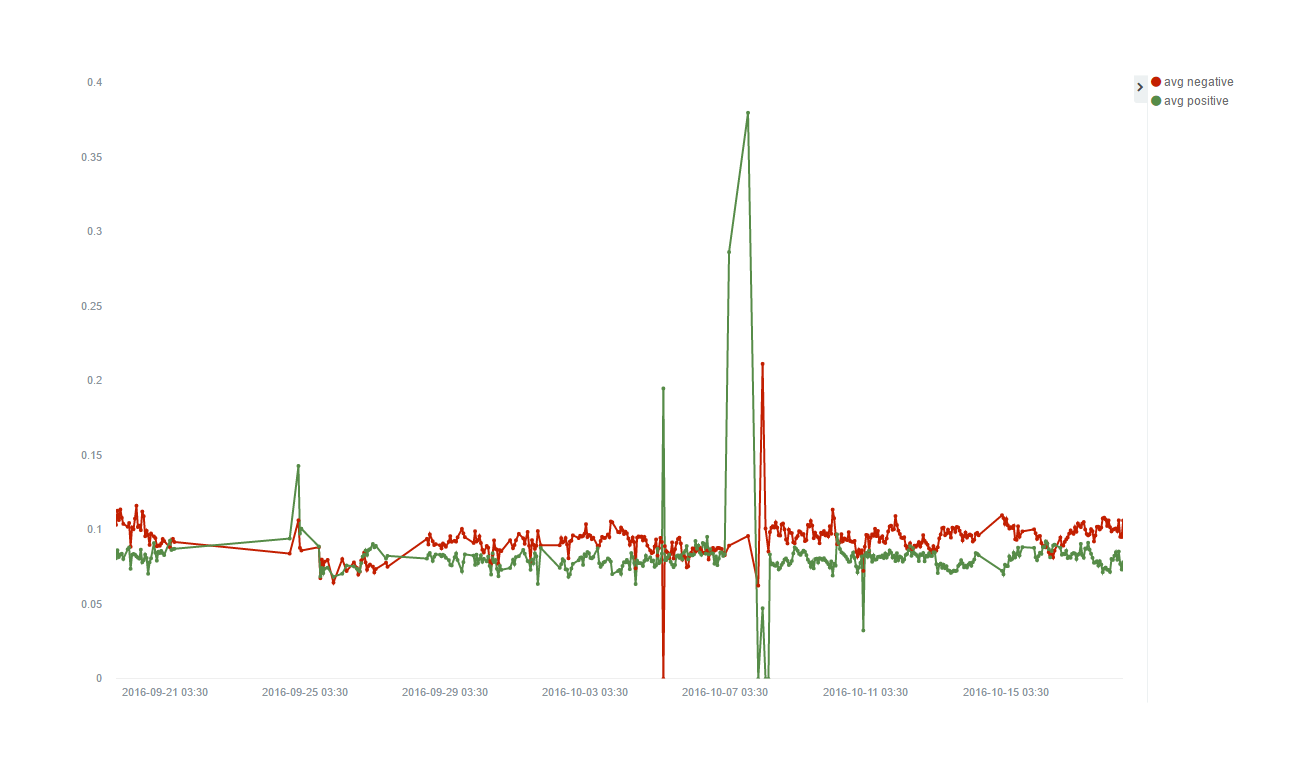
Analyzing the tweets using the Sentiment Analysis technique, we scored every single tweet based on the feeling the tweet has toward each candidate with a number between -1 to 1 (-1 being ultimate hate and 1 being ultimate interest). After scoring every tweet, we then categorized the tweets based on the candidate each tweet is related to and below is a summary of what we obtained.
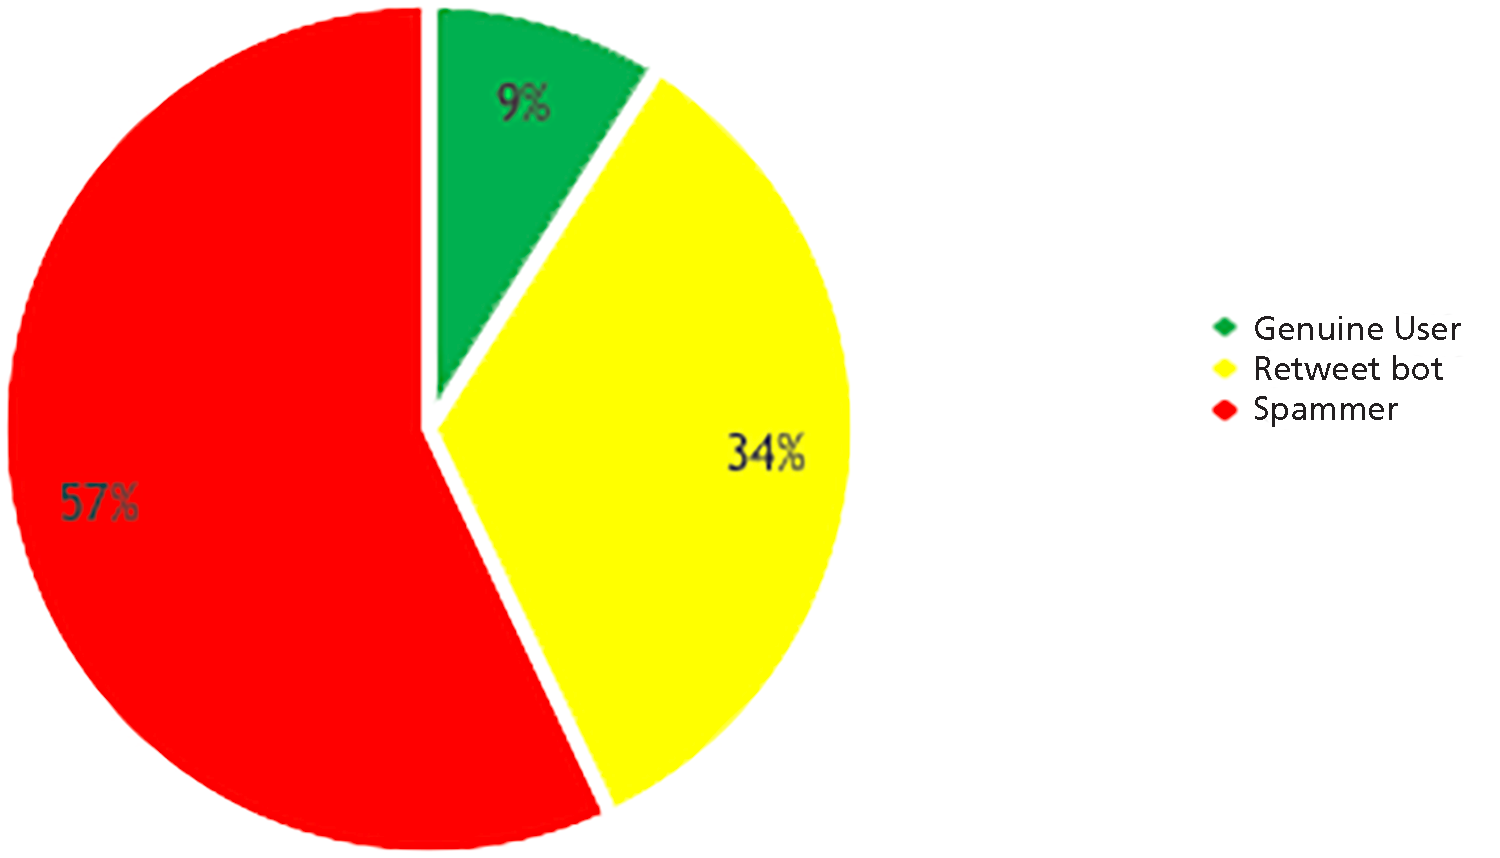
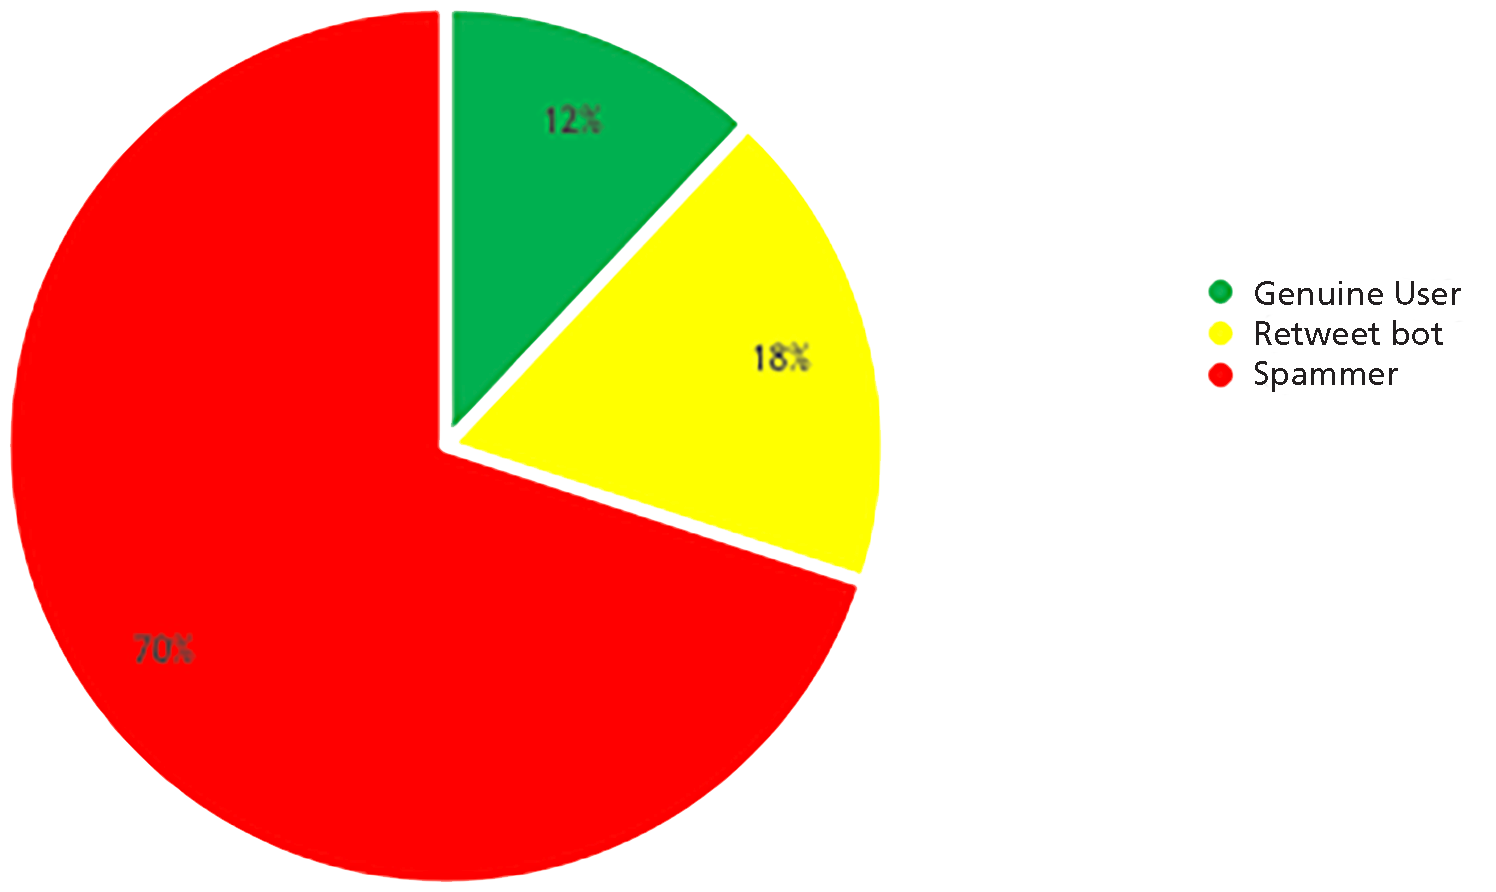
The result of analyzing the top 100 Twitter accounts that had the highest number of positive tweets for each candidate shows that a large percentage of these were fake accounts or what is known as spammers.
The results that our data mining team obtained also suggested that tweets that are about Hillary Clinton contained the largest number of negative feelings compared to her republican rival.
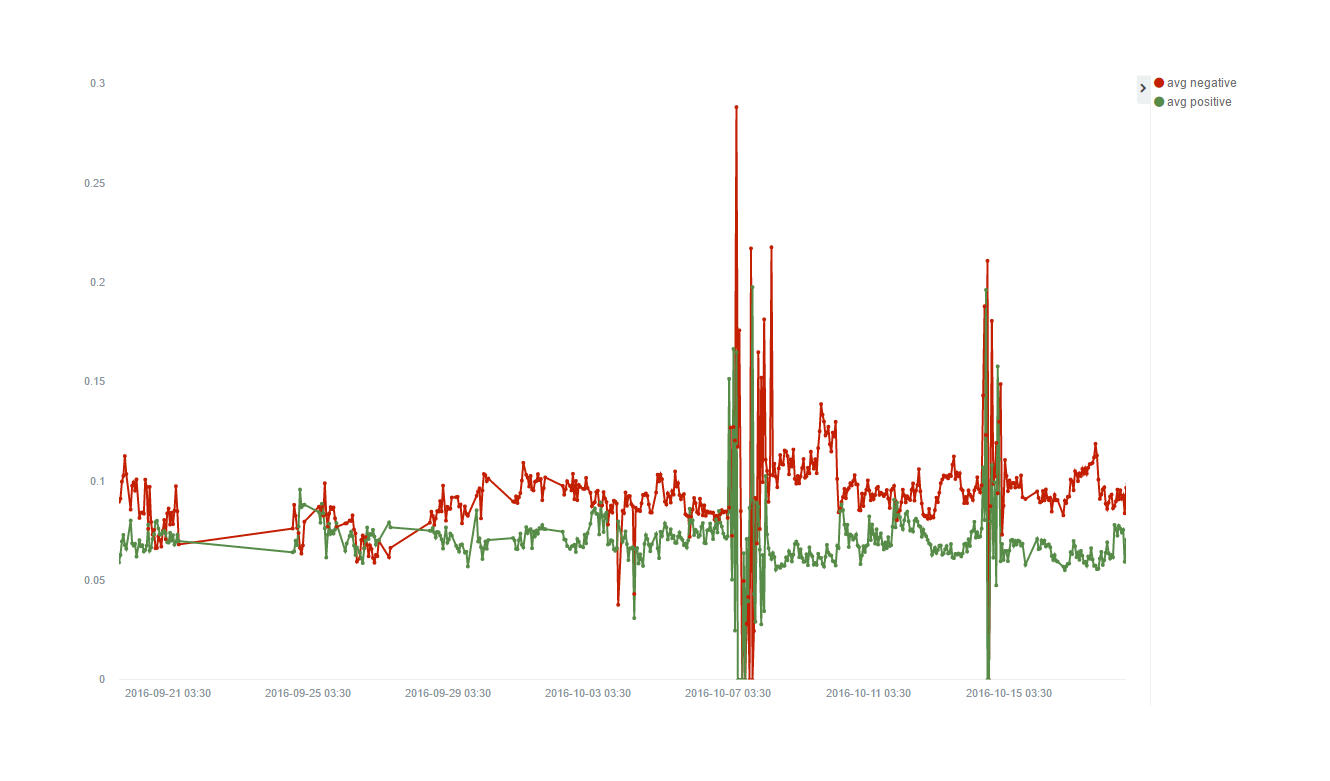
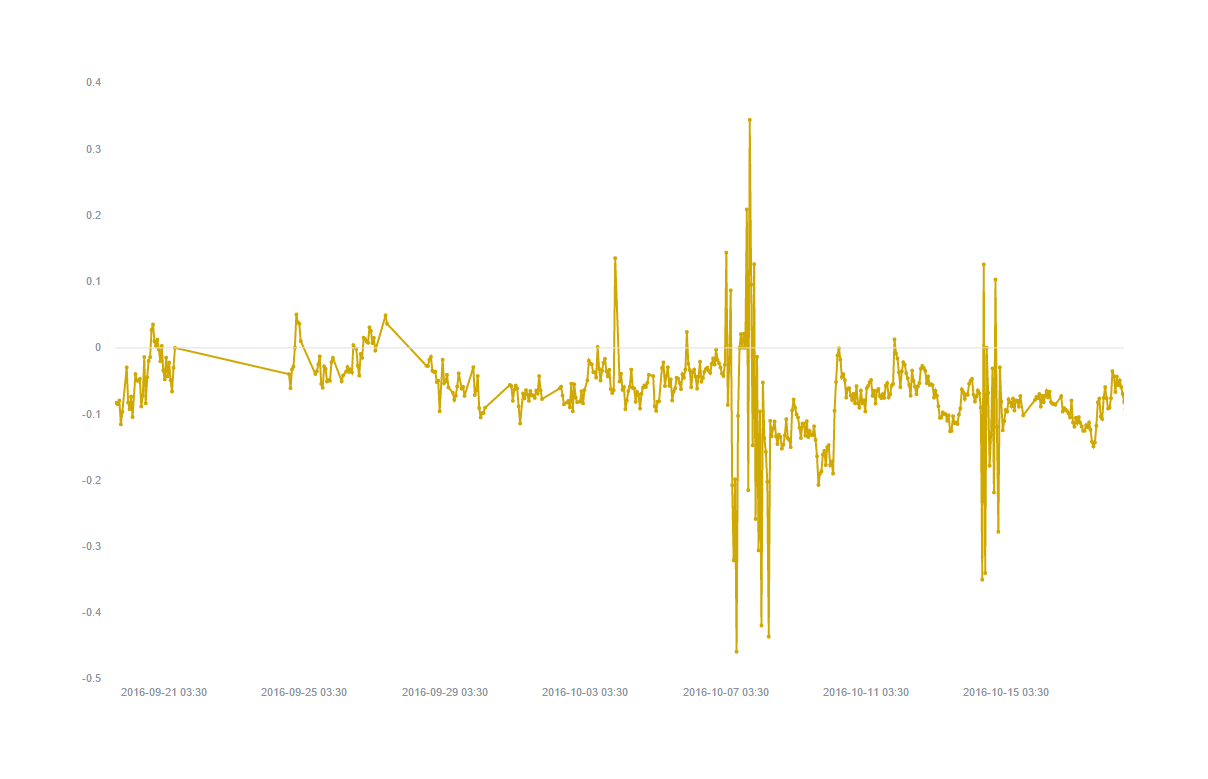
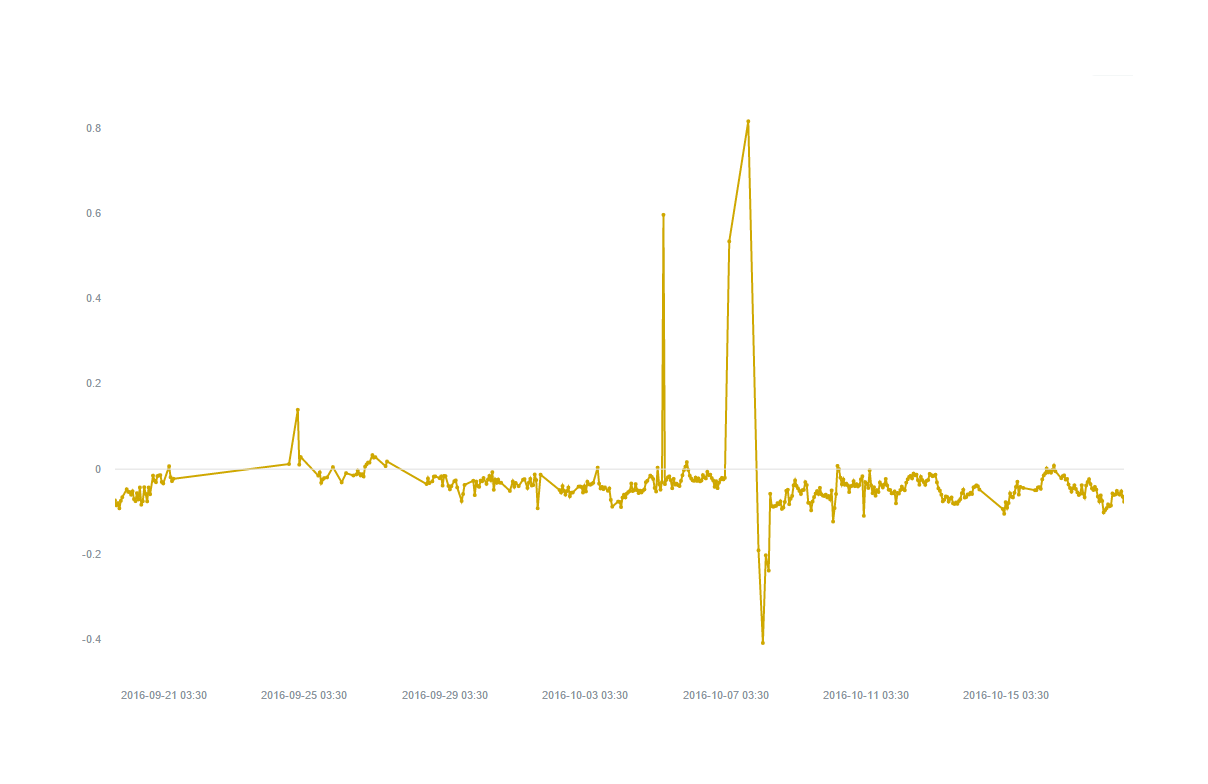
According to the data we obtained and analyzed, our team has also learned that users mainly express negative feelings toward both candidates. These charts that are the result of adding the two above-mentioned charts show that the average sentiment score of tweets for each candidate during the specific time is mainly negative.
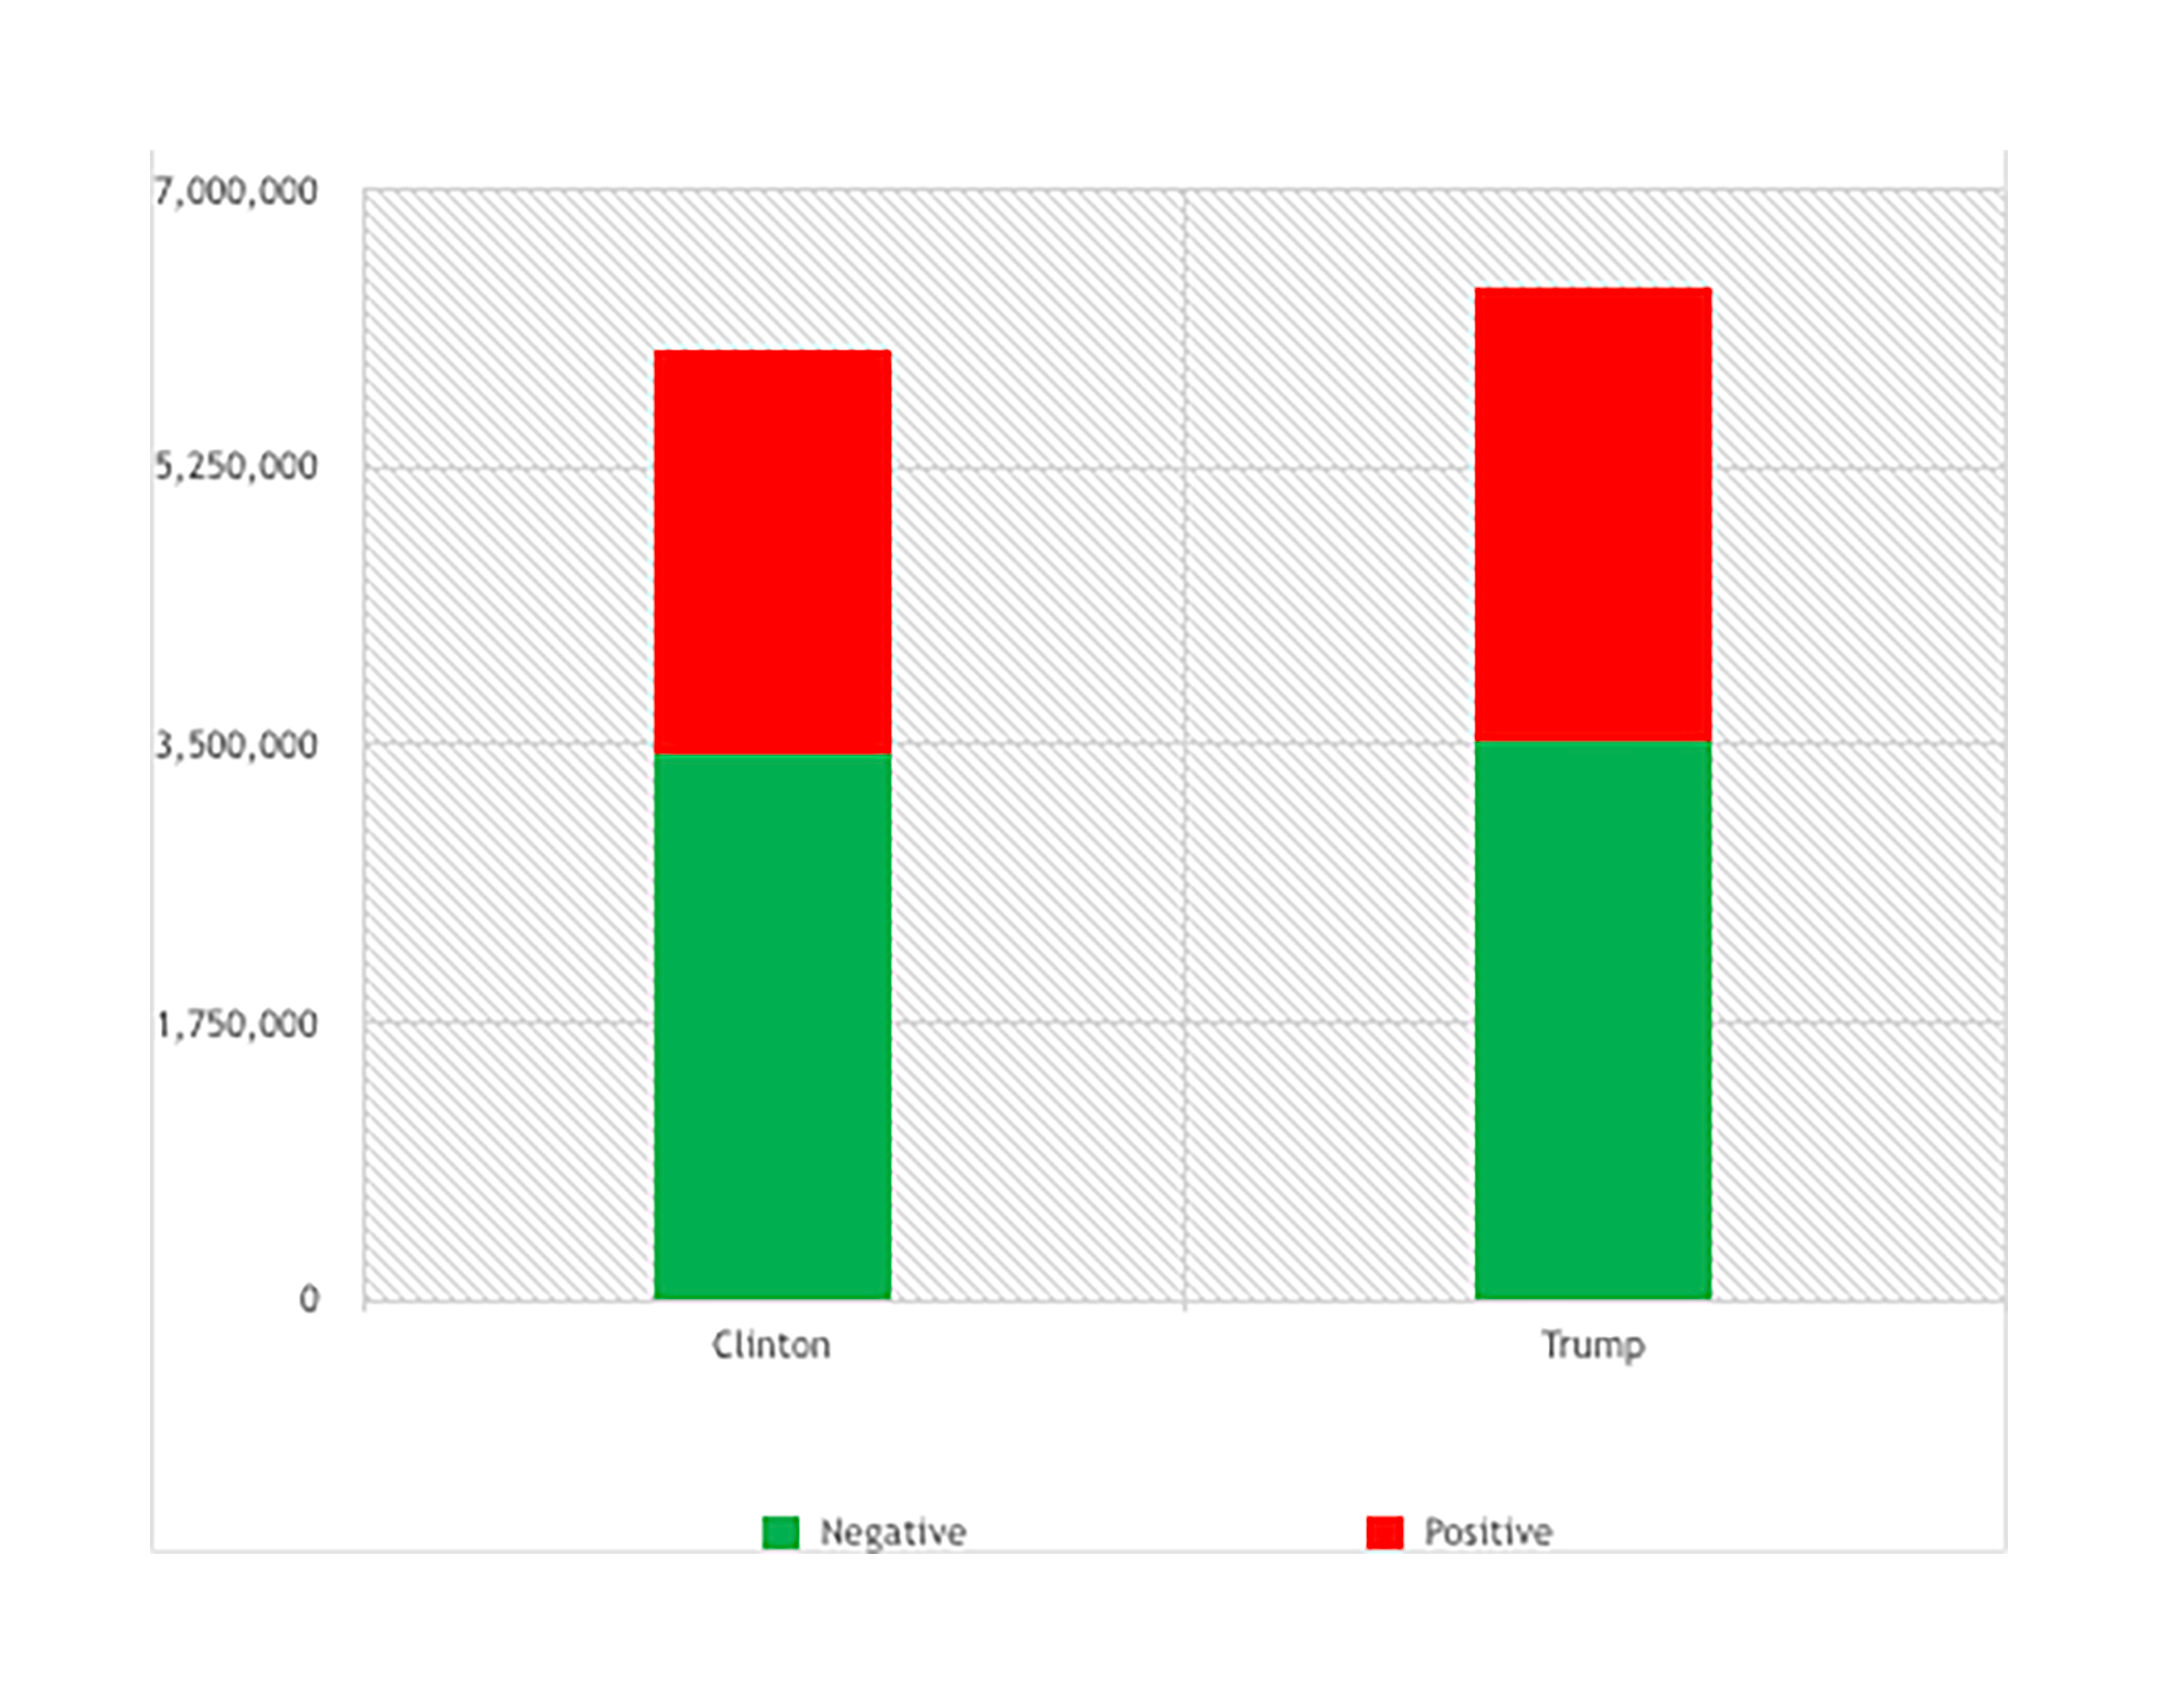
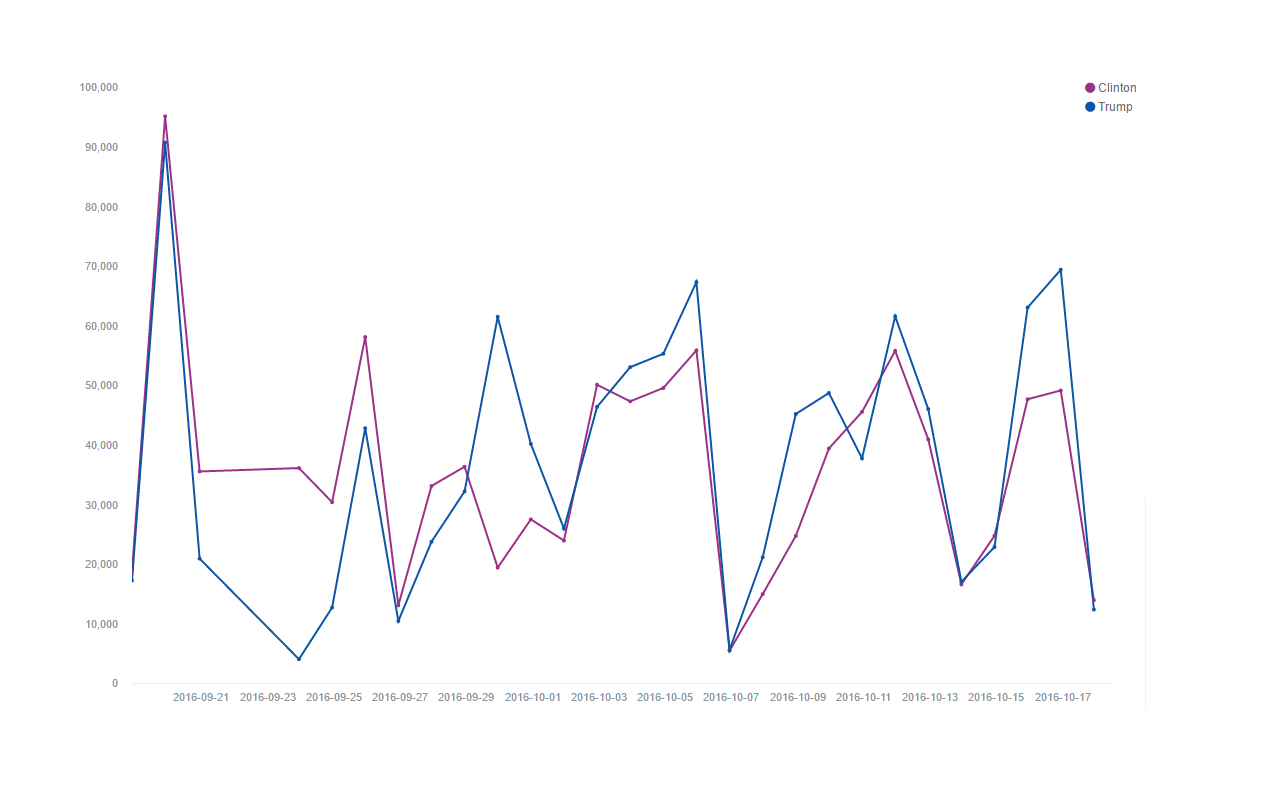
And at the top of the adjacent column is the sentiment analysis chart based on the number of tweets obtained for each candidate. As one can see, the total number of positive and negative tweets for Donald Trump is more than his Democrat rival. According to the following chart, Trump is the leading candidate in attracting positive feelings in the 24-hour period.
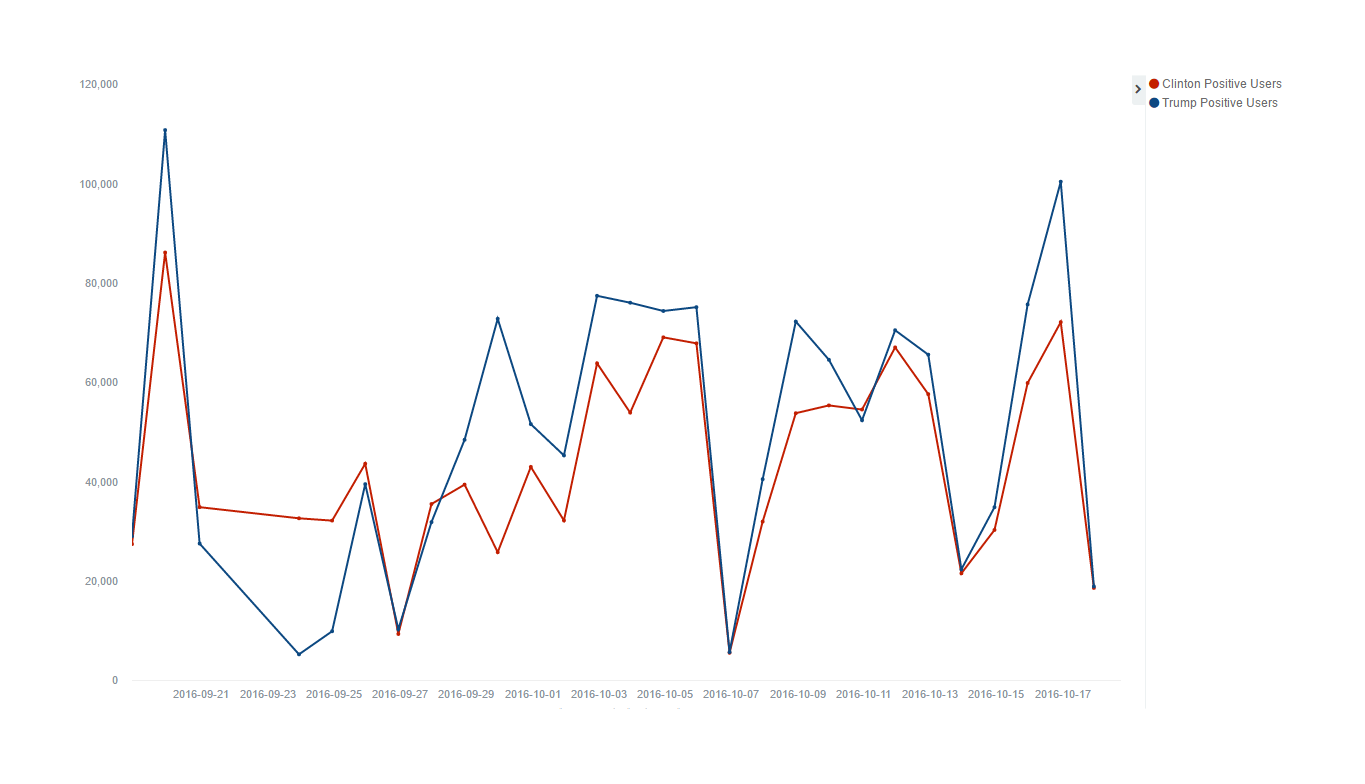
The next chart down also shows the number of accounts that mainly tweeted with a positive attitude toward each candidate. The chart shows an increase in the number of Twitter fans for Donald Trump after September 27 and the number then surpasses that of his Democrat rival after September 29. It is worth mentioning that the first presidential debate between the two candidates was held on September 26.
As can be seen in the graph detailing the positive tweets regarding both candidates, beginning from September 27, the number of positive opinions tweeted about Trump increased and were in total higher than that of Clinton.
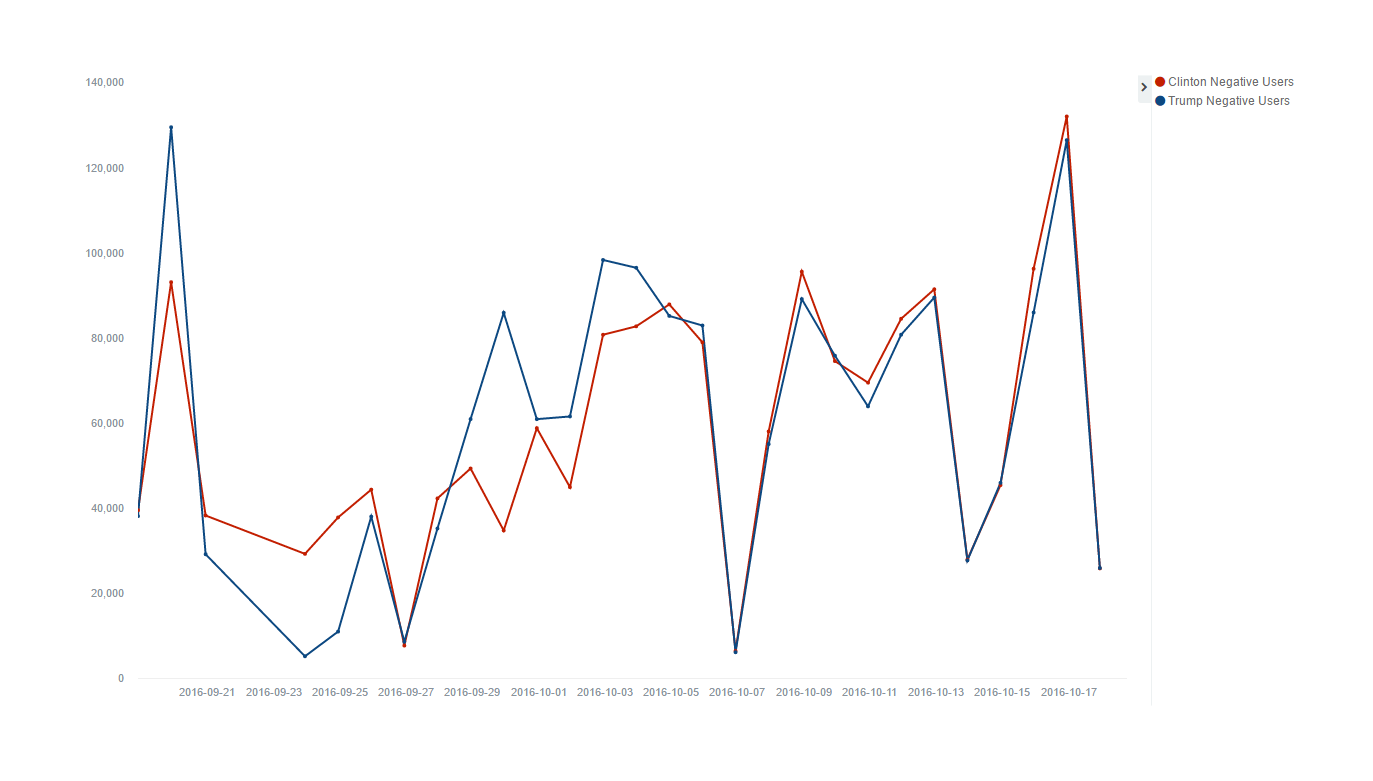
In the adjancent graph, users with a negative view toward either of the candidates were examined. As can be seen, the number of users with a negative opinion of Hillary Clinton was slightly higher than those who held a negative opinion of Donald Trump.
https://www.twitter.com/Sahab_Media
https://www.facebook.com/Sahab-Media-1088932284517820/


Donald Trump’s stunning victory has left not only the American establishment but the rest of the world also shell-shocked. This is not how...
3Defying all predictions, Donald Trump won the US presidential elections against his Democratic rival Hillary Clinton. He has exposed the US ...
One of the remarkable aspects of the American system is that people actually believe they have a say in how their president is elected. The ...
2Is there a difference between Hillary and Trump? Americans are caught between a rock and a hard place writes John Vanderbilt.
1